Moment of truth: How does the model perform when run on all 15,000 items? Model and data configuration (based on previous findings):
For the final test, I selected a model with group features but without synthetic data. This setup proved to be the most stable across the entire assortment, although synthetic data remains an interesting option for future projects or specific subsets of products.
| Metrics | Full dataset | 33 months | 13-32 months | |||
|---|---|---|---|---|---|---|
| Value (ALL) | Value (Item) | Value (ALL) | Value (Item) | Value (ALL) | Value (Item) | |
| WAPE | 30.1022 | 49.7127 | 28.1069 | 41.6723 | 33.4304 | 40.1634 |
| RMSE | 45.907 | 22.3895 | 50.4051 | 23.9145 | 26.3204 | 17.0358 |
| R² | 0.9232 | 0.93 | 0.7245 | |||
| MAPE | 65.5438 | 57.332 | 60.9407 | |||
| ROBUST | 0.551 | 72.2735 | 0.5498 | 58.7128 | 0.5049 | 66.3819 |
| STABLE | 0.3884 | 0.3642 | 0.5422 | |||
| Metrics | 6-12 months | 1-6 months | no history | |||
|---|---|---|---|---|---|---|
| Value (ALL) | Value (Item) | Value (ALL) | Value (Item) | Value (ALL) | Value (Item) | |
| WAPE | 38.5444 | 45.8518 | 44.6778 | 47.1055 | 80.7317 | 220.7146 |
| RMSE | 26.6287 | 17.1458 | 43.1306 | 27.5178 | 95.9705 | 61.587 |
| R² | 0.7529 | 0.7451 | -0.1913 | |||
| MAPE | 64.676 | 79.1142 | 186.139 | |||
| ROBUST | 0.5233 | 66.5118 | 0.5441 | 89.7998 | 0.4013 | 250.967 |
| STABLE | 0.4801 | 0.4776 | 0.9196 | |||
Results by history length:
Compared to Chapter #9 (partial dataset test), the metrics are practically identical – the model maintains stability even with triple the dataset size. A slight improvement is visible for SKUs with short history, mainly thanks to a greater number of categories within groups → richer embedding data → better pattern transfer.
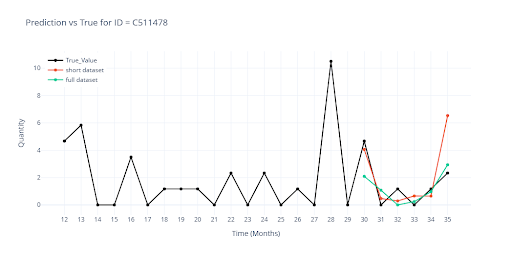
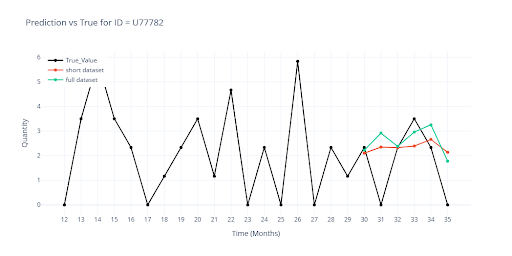
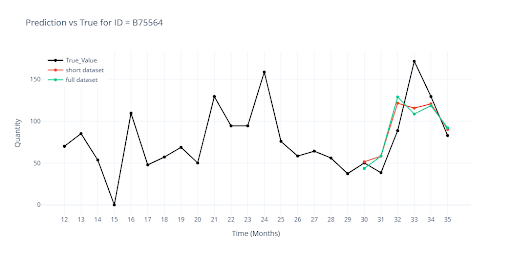
The charts compare the prediction from the partial dataset (previous chapter) with the new prediction from the full dataset.
The most visible differences are found in SKUs with short history – here, group-level information now plays a much stronger role. For longer histories, the curves almost perfectly overlap, confirming that expanding the training dataset to the full range did not harm performance for established items.

The model performs very well on the full dataset, so I also tested how it handles promotional campaigns. In the training data, the model receives information about when and how long a given product was on sale. Within feature engineering, I also add additional context:
The visualization shows the difference in forecasts when an item had a planned discount vs. no discount.
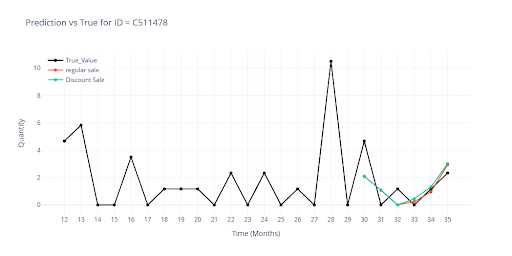
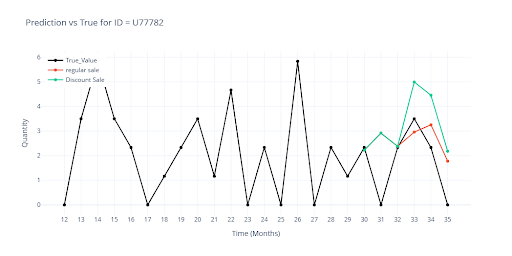
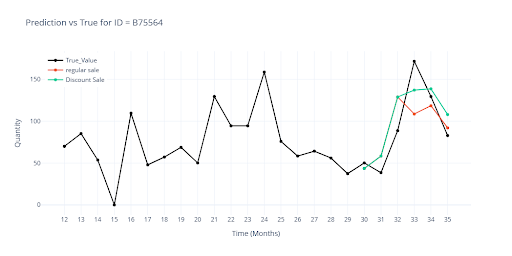
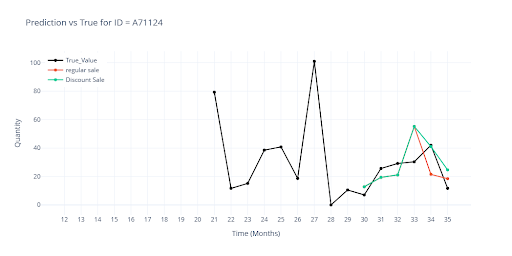
This shows that the model can make decisions based on the actual historical impact of promotional events, and that a discount by itself is not a universal trigger for increased sales.
To deliver a complete solution to the customer, I trained the final version of the model – this time on the entire 42-month history (some months months have passed since the start of the project).
This time, there is no validation window, so the evaluation is done by visually comparing the model’s output with the customer’s internal forecast and the actual sales (which I backfilled retrospectively). Even without precise metrics, the key takeaway is that the customer is satisfied and sees clear value in the project.
What the visualization app shows
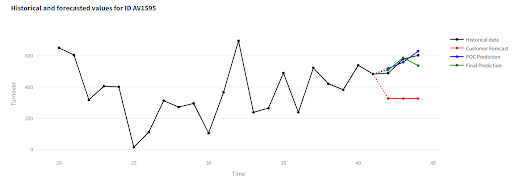

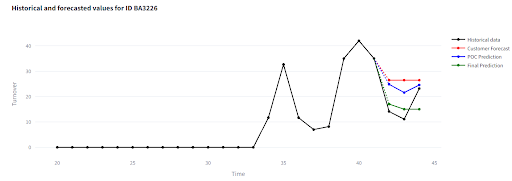
👉 Try the results yourself: https://demo-inventory-forecasts.streamlit.app/
(If the app is sleeping, click “Yes, get this app back up!” – it will be ready in under a minute.)
Note: All data shown is anonymized and slightly modified to remain informative.
After ten chapters, thousands of experiments, and terabytes of trained data, I’ve finally reached the final solution.
Throughout the project, I have:
Final choice:
A TFT model with group-features, without synthetic values, trained on items with at least 1 month of history.
The result?
Stable predictions across the ntire assortment, strong seasonality preservation, and the ability to correct errors in the customer’s manual forecasts.
IČO: 172 28 018
DIČ: CZ 172 28 018
Data Box ID: ykwdnxf
sales@neebile.cz
Jičínská 226/17, Praha, Žižkov, PSČ 130 00 Česká republika
(910) 658-2992
© 2025 Vytvořeno DigitalWays
