Inventory Forecasting with AI
1. Project Introduction & Objectives
Smart inventory planning is a challenge not only for large corporations but also for small and medium-sized businesses across industries. Today, AI opens up entirely new possibilities for them.
After three years of deep study in AI, I decided to launch my own project: applying deep learning to inventory forecasting.
Why this topic? A colleague asked me whether artificial intelligence could help solve inventory planning problems in a wholesale business.
It quickly became clear that inventory management is a never-ending balancing act — too much stock means unnecessary costs, too little means lost sales and frustrated customers. On top of that, many dynamic factors come into play.
How to Read This Series
The goal of this series is to make the world of inventory forecasting with AI accessible to business professionals — those who deal with operations and inventory planning in practice and want to understand how AI and modern data tools can help.
I won’t dive into technical details. Instead, I’ll focus on real-world challenges and how I addressed them. Each article will present a specific problem, show how I tackled it, and support it with examples or charts — so you can get a clear picture of what AI can (and can’t) do in supply chain forecasting.
My aim is to provide value both to business managers who want to explore AI’s potential and to analysts interested in how data handling and modeling decisions impact forecasting results. All data used in this series come from real projects, but have been anonymized. New articles will be published progressively, as I gather new insights and practical examples.
The Business Problem
- Tens of thousands of unique product SKUs
- Categorized by seasonality, type, product category, and segment
- Dozens of new items created and discontinued each month
- Promotions and special discounts applied irregularly
- Forecasts and ordering handled manually by purchasing teams
Project Goal
Project Goal
To build a system that can:
- Track current inventory levels
- Predict future sales
- Take into account additional variables such as lead times, supplier reliability, promotions, etc.
- Recommend order quantities and automate min/max inventory thresholds
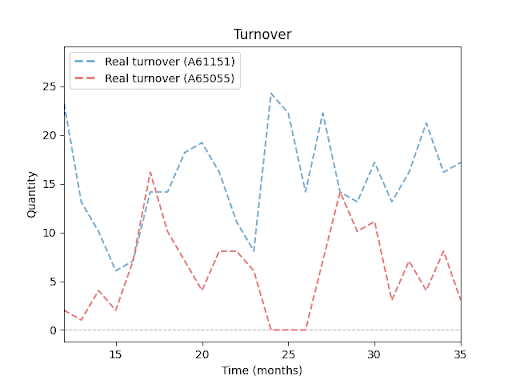
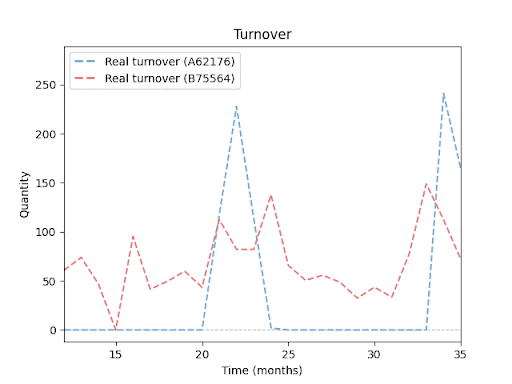
Sales trends over time for various products (SKUs):
The following charts illustrate sales trends for four different products over a 24-month period. Each line shows the sales volume of a single product. You can clearly see how these products differ — in sales volume, seasonal patterns, and even periods with zero sales. These variations highlight why inventory forecasting is hard — and why it requires a much more sophisticated approach than a simple average or basic extrapolation.


Project Definition
To meet the project goals, we first needed to clearly define the specific requirements, constraints, and risks involved. The solution must:
- Automatically recommend monthly min/max inventory levels for each SKU
- Take into account multiple parameters:
- Product categorization
- Promotional sales
- Seasonality
- Sales history
- Similarity between products
- New product launches
- Be financially feasible
- Allow companies to test the model on their own data
Project Risks & Challenges
From the beginning, it was clear that the model would face a wide range of challenges:
- One-time sales spikes
(e.g. sudden bulk orders or unplanned demand surges) - Frequent assortment changes
(tens of products introduced or discontinued each year) - Varying sales history lengths
(new items vs. long-standing products) - Zero sales periods
(months without demand, followed by sudden activity) - Large variance in sales volumes
(from one-piece-per-month SKUs to thousands of units sold) - Product interdependencies
(sales of one item influence demand for another) - Impact of seasonality and planned promotions
The objective was not only to build a model that can predict average demand, but also one that can handle these irregular, complex, and often unpredictable scenarios.
Sales History Coverage Table
The sales history table illustrates the variability in how much historical data was available per product.
While the majority of products had a complete 3-year history, a significant portion had only limited or no historical data — posing a major challenge for traditional forecasting models
| Product history length | Number of items | Share of assortment |
|---|---|---|
| 36 months (full history) | 10 105 | 70.00% |
| 12–35 months | 2 668 | 18.00% |
| less than 12 months | 1 211 | 8.00% |
| no history | 519 | 4.00% |
Solution – In a Nutshell
Many companies assume that feeding data into an AI model is enough to get useful results.
As this project showed, the reality is far more complex.
Initial tests revealed that even modern deep learning models (used out of the box) were not sufficient — they struggled with high assortment variability, frequent product turnover, and a large number of zero-sale periods.
The project gradually expanded in scope. It became necessary to:
- Improve data preparation (feature engineering)
- Train models to handle extreme values
- Address varying history lengths
- Dynamically scale inputs based on context
Today, the model handles most of these challenges automatically, with minimal manual intervention.
Results
| Metric | Value | Business Meaning |
|---|---|---|
| Forecast Accuracy | 80% | How accurately the model predicted future sales. |
| Average Deviation | 48 | Average difference between predicted and actual sales. |
| Mean Absolute Error | 31 | Average size of the error in number of units sold. |
Key Strengths of the Solution
- Forecast accuracy over 80% across the full product assortment
- Model leverages both individual sales history and group-level patterns from similar products
- Special attention to promotional and discounted items
- Capable of forecasting newly introduced products with minimal historical data
- Responsive to both seasonal effects and short-term trends
- Automated outputs generated for the entire assortment
Scalability and Reusability
The solution is highly adaptable and can be configured for different clients or datasets.
Most algorithms and core components are predefined and reusable.
While expert knowledge is still required for initial setup and result interpretation, the deployment and validation process is much faster compared to custom development from scratch.
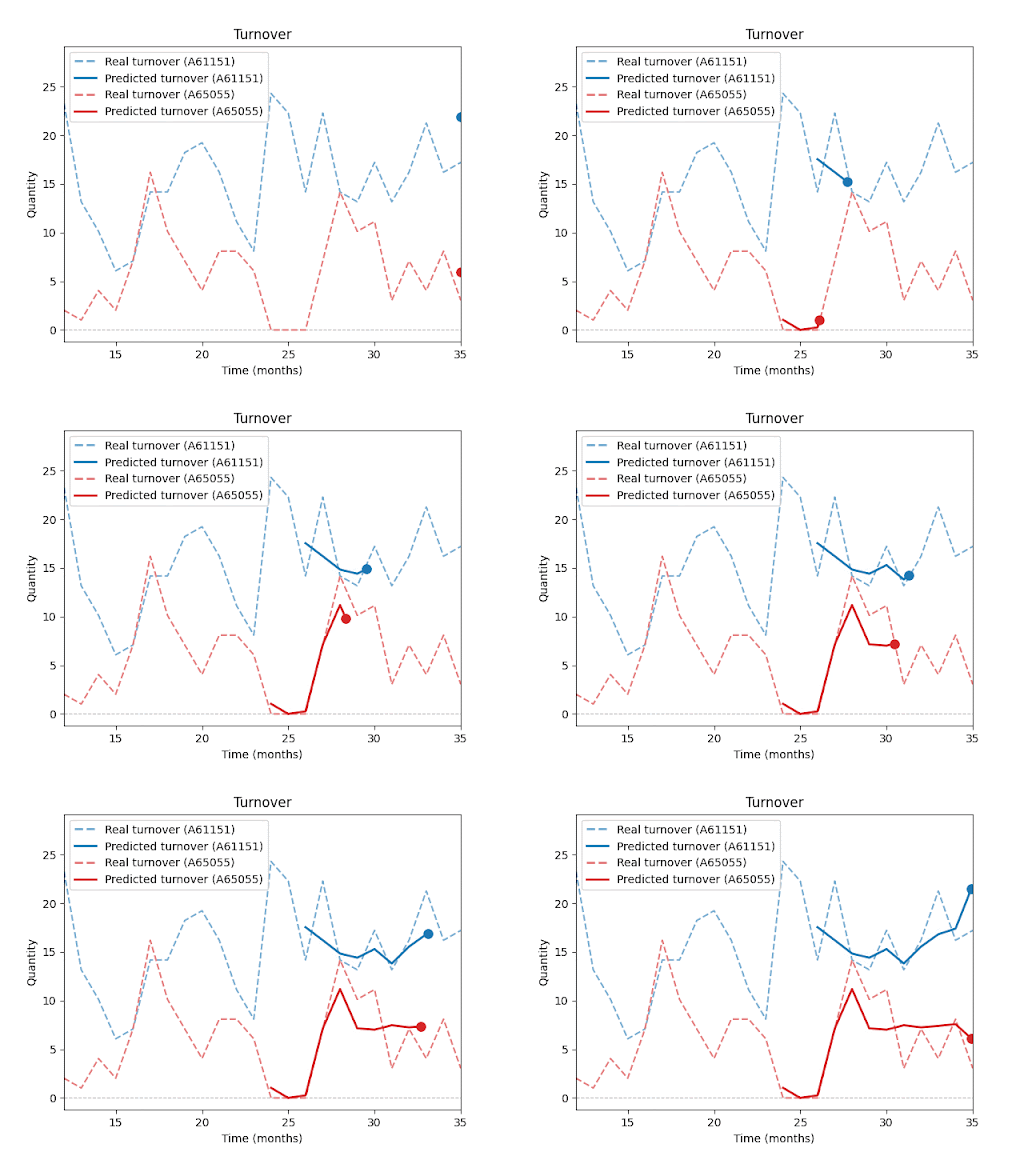
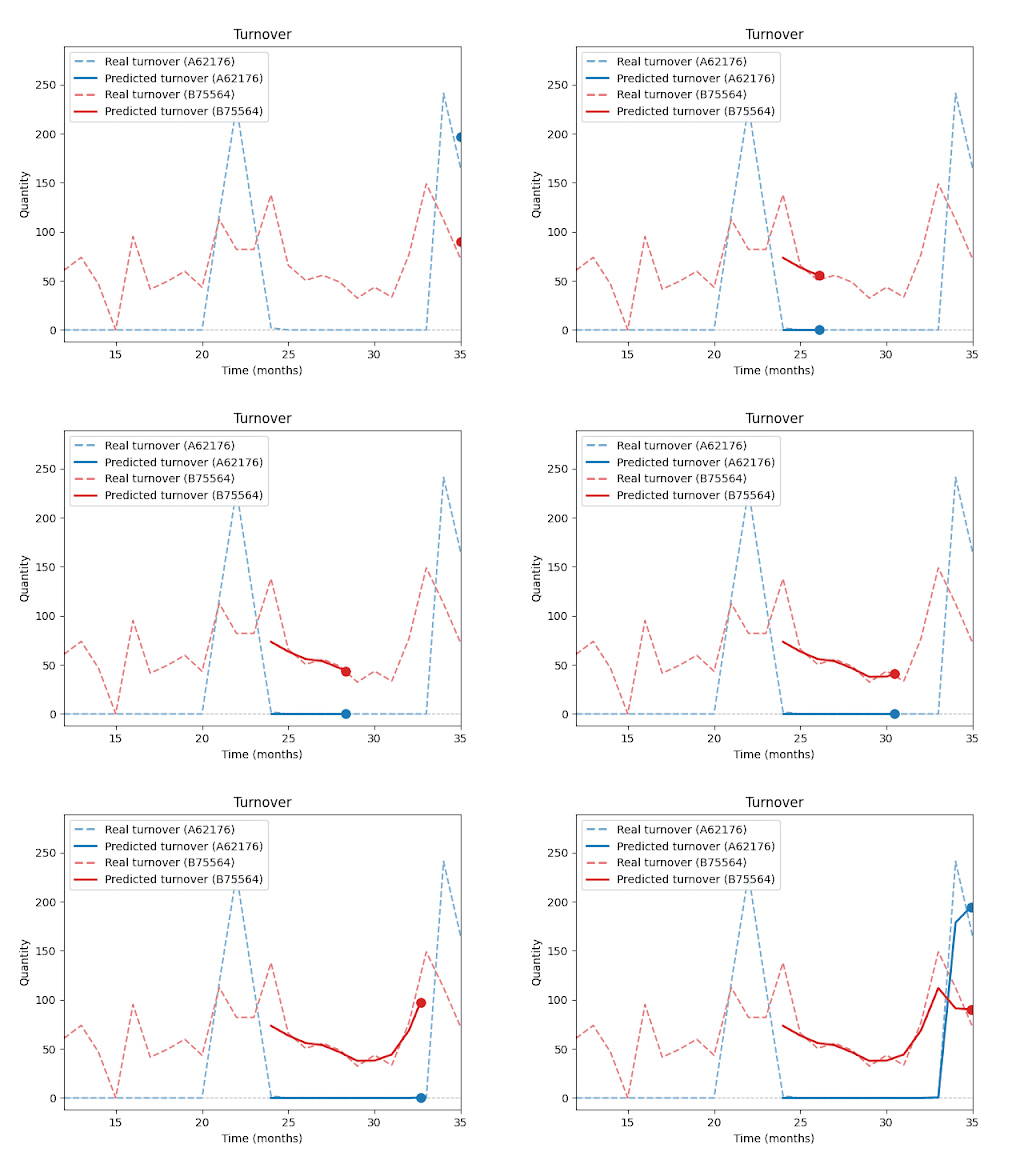
Forecast vs. Reality – Visual Results:
The following charts (not shown here) compare actual vs. predicted sales for selected SKUs.
You can clearly see that the model is able to capture overall sales trends and seasonal fluctuations, even for products with inconsistent histories or irregular sales spikes.At the same time, these charts highlight a key insight: Even with advanced forecasting, a certain level of uncertainty remains, especially during unexpected peaks or drops.


In upcoming parts of this series, I will explore in more detail how forecast performance is influenced by factors such as historical depth, assortment composition, seasonality, and promotions.
Technology Stack
The entire project was built on the PyTorch framework, one of the most widely used open-source platforms for deep learning.
Training was done on an NVIDIA RTX 3090 GPU with 24 GB of memory, which made it possible to efficiently handle large-scale datasets and experiment with various scenarios — including models with hundreds of millions of parameters — without significant time delays.
The infrastructure ran on Kubernetes, making the solution easily scalable and portable — it can be deployed on-premises or in the cloud, depending on the client’s needs.
