Some products sell dozens of units for several weeks in a row. Then come weeks with no sales at all. And after that, demand suddenly returns. This is exactly where traditional forecasting approaches often fail. Long periods of zero sales can easily lead to the conclusion that future demand will also be zero.
Reality, however, is often more complex. For many products, zero sales do not mean demand has disappeared — only that it occurs irregularly. This is where many costly decisions are made. A product may be classified as inactive even though demand will return later.
The question is often not only:„How many units will we sell?“
But also: „Will there be another sale at all??“
In the following real-world scenarios, I demonstrate different types of irregular product behavior.
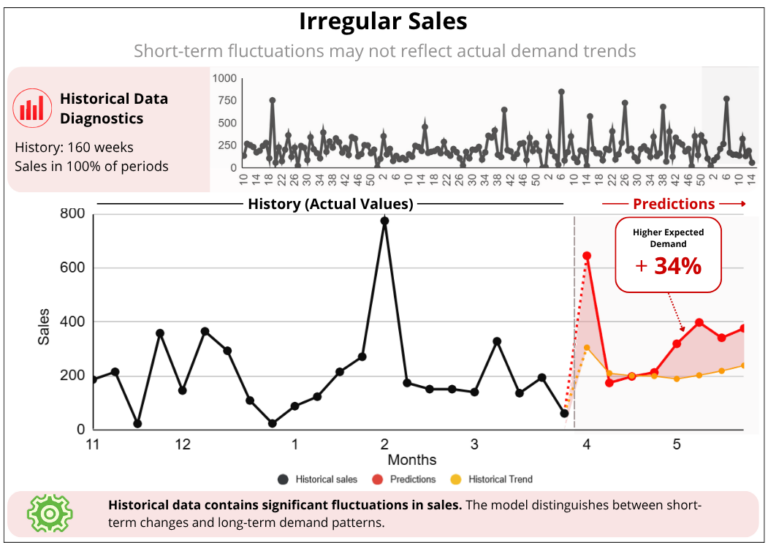
The historical data contains a large number of sales observations, but also significant short-term spikes. At first glance, these spikes may appear to signal the beginning of a new trend.
In reality, however, they may simply represent short-term fluctuations rather than a change in underlying demand. The goal is therefore not to replicate every extreme value, but to distinguish short-term noise from the product’s true behavior.
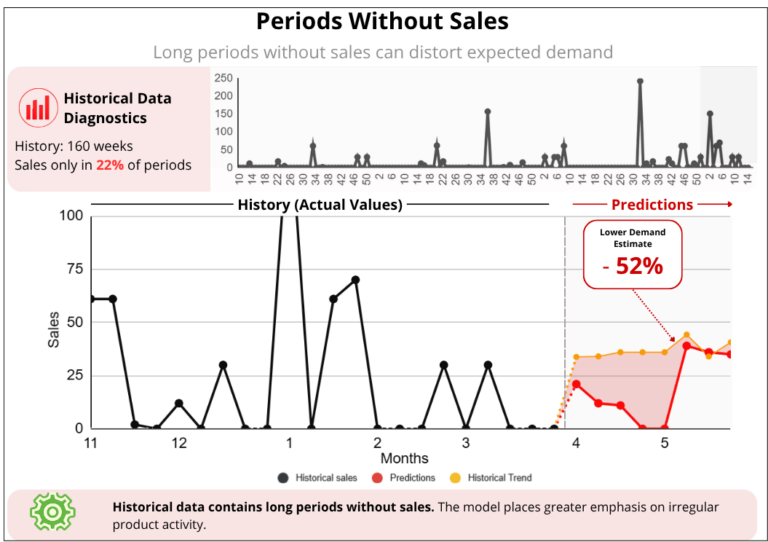
At first glance, a long period without sales may look like the end of demand. However, the historical data shows that the product repeatedly returns to an active state.
The biggest challenge is often not estimating the quantity of future sales. The biggest challenge is estimating whether another sale will occur at all. If a product is classified as inactive too early, the company may reduce inventory precisely when demand is about to return.
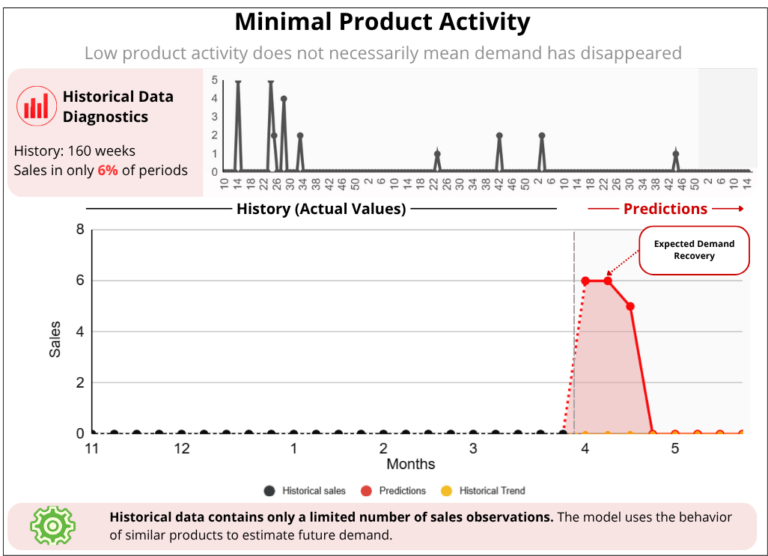
In extreme cases, a product may sell only a few times during the entire observed period. From a traditional forecasting perspective, it becomes very difficult to distinguish random sales from a genuine demand pattern.
The question here is often not how many units will be sold. The question is whether demand will return at all.
Yet inventory planning may still be required for such products. The model therefore does not rely solely on the product’s own history but also leverages knowledge learned from similar products and their historical behavior.
Irregular sales patterns are among the most challenging scenarios in inventory planning. The problem often lies not only in estimating demand volume, but in determining whether demand will appear at all.
As the previous examples demonstrate, zero sales do not automatically imply zero future demand. For many products, long periods without sales may simply represent extended intervals between purchases.
Drawing the wrong conclusion can lead both to stock shortages and to unnecessary capital being tied up in inventory.
Note: All examples shown are real model outputs generated from anonymized customer data.
IČO: 172 28 018
DIČ: CZ 172 28 018
Data Box ID: ykwdnxf
sales@neebile.cz
Jičínská 226/17, Praha, Žižkov, PSČ 130 00 Česká republika
(910) 658-2992
© 2025 Vytvořeno DigitalWays