One of the key factors that repeatedly proves to be critical in practice is the length of available historical data. In many cases, it determines whether a model can successfully capture trends and seasonality, or whether its predictions begin to break down.
This issue becomes especially important in environments where product portfolios constantly evolve and new items are introduced without sufficient historical data.
To better illustrate this problem, I will use a specific dataset that represents a typical retail forecasting scenario very well. It clearly demonstrates how differences in historical depth across products influence the behavior of individual forecasting models.
The dataset contains monthly sales data for approximately 15,000 products over a four-year period. At first glance, the dataset appears relatively simple. However, a deeper analysis reveals significant variability between products, particularly in terms of historical depth and sales stability.
The differences are also visible in sales volumes:
The basic characteristics of the dataset are summarized in the following table:
| Parameter | Value |
|---|---|
| Number of products | 15 000 |
| Data frequency | Monthly |
| Longest history | 48 months |
| Shortest history | 1 month |
| Share of periods 1–6 months | 2.7% |
| Share of periods 7–12 months | 4.6% |
| Share of periods 13–24 months | 6.6% |
| Share of periods 24+ months | 86.1% |
| Average sales volume | 54.7 |
| Median sales volume | 14 |
| Maximum sales volume | 39 097 |
| Share of zero sales | 8.1% |
From a demand planning perspective, this represents a typical scenario that clearly illustrates the challenges forecasting models face in real-world environments.
The length of available historical data is one of the key factors affecting forecast quality. For this reason, all experiments were performed on subsets of the dataset divided according to the history length of individual products — ranging from the entire portfolio to items with very limited historical data.
This variability itself represents a major challenge, as models must handle products with significantly different behavior patterns, often with only a limited amount of available data.
To compare the individual approaches, a unified validation strategy was used. Models were trained on historical data and evaluated on the following time period. This setup reflects real-world forecasting usage, where future demand is predicted based on past observations. Model performance was evaluated using a combined metric derived from multiple standard forecasting accuracy measures. The objective was not to optimize a single metric, but to obtain a more robust view of prediction quality across different product types.
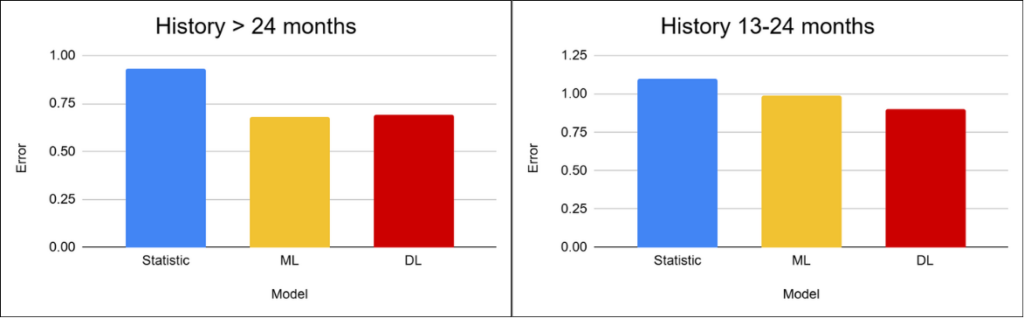
The resulting value represents the overall prediction error — the lower the value, the more accurate the forecast. However, the results must always be interpreted in the context of individual scenarios, as differences between models vary significantly depending on history length and data characteristics.
For better interpretation, the scenarios are further divided according to product history length.
The differences between approaches are relatively small in this scenario, meaning that more complex models do not provide significant additional value relative to their cost and complexity. The models have sufficient historical data to capture both trends and seasonality, which allows even simpler statistical methods to perform well. Machine learning and deep learning models achieve slightly better results, but the differences become visible mainly for seasonal and promotional products, where behavior is less stable.
In this scenario, more complex models (DL) therefore do not provide a substantial advantage considering their computational and implementation complexity.
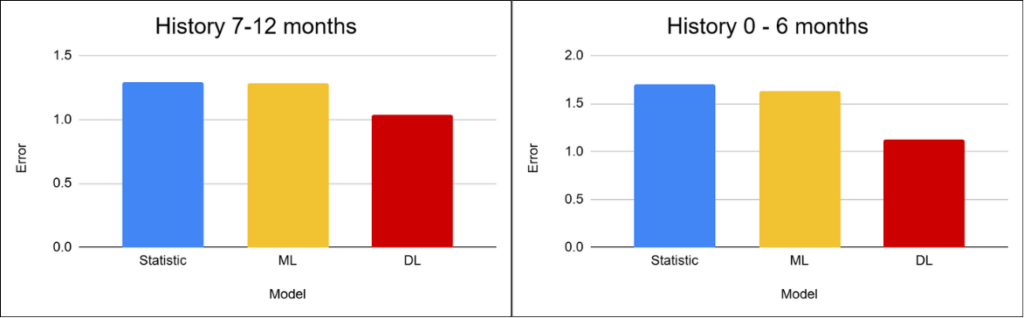
As the available history becomes shorter, the differences between approaches become more significant. Statistical methods gradually lose the ability to capture seasonality because they no longer have enough data. Machine learning maintains relatively stable performance, while deep learning begins to gain an advantage due to its ability to work with more complex relationships and contextual information.
The key reason behind these differences is precisely the length of the available historical data.
The most challenging scenarios involve products with a very short history. In these cases, all approaches operate with severely limited information, leading to a noticeable decline in accuracy across all models. Deep learning gains an advantage here due to its ability to identify similarities between products based on additional characteristics and contextual features. Even so, the forecasts remain highly uncertain, and their practical usability is limited.
The main challenge is therefore not only the choice of model itself, but primarily the lack of sufficient high-quality data.
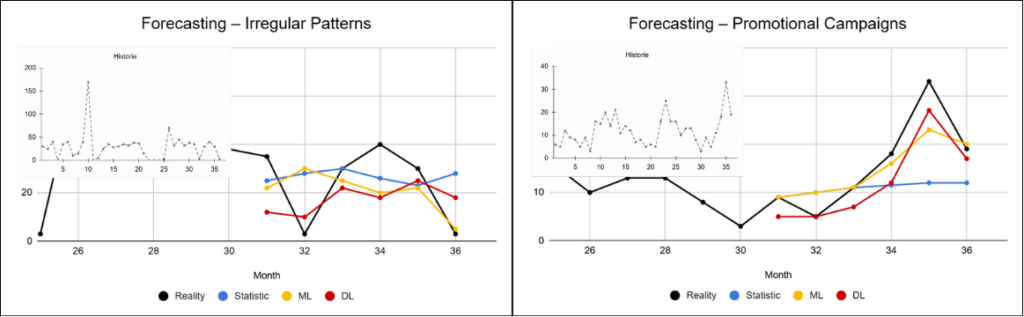
The previous results showed the differences at the level of entire groups. Let us now look at several specific examples that better illustrate how the individual approaches behave in practice. The black curve represents the actual values, while the colored curves represent the predictions produced by the individual approaches.
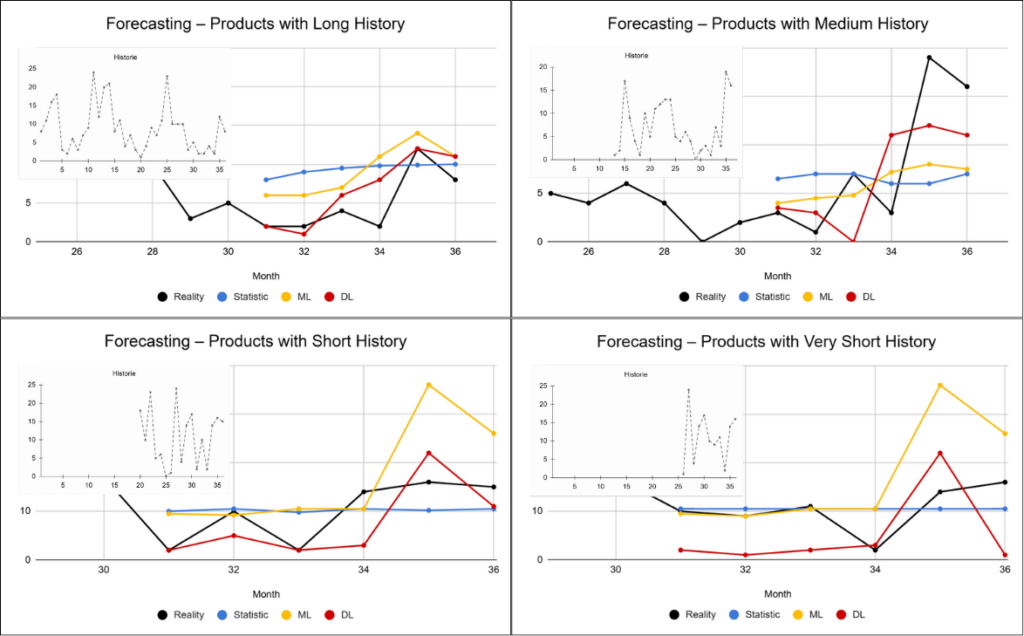
These examples clearly illustrate the different behavior of the individual approaches. Statistical methods tend to smooth predictions and revert toward the mean, which often leads to underestimating peaks and overestimating weaker periods. Machine learning responds to changes more effectively, but often with a delay. Deep learning is capable of capturing more complex patterns and reacting more quickly to changes, although in some cases it can also be more sensitive to noise.
These differences become even more pronounced depending on the available history length – the less data available, the more the limitations of simpler approaches begin to appear.
Besides historical depth, there are several other factors that significantly influence forecast quality and often represent the primary reason why models fail in real-world scenarios.
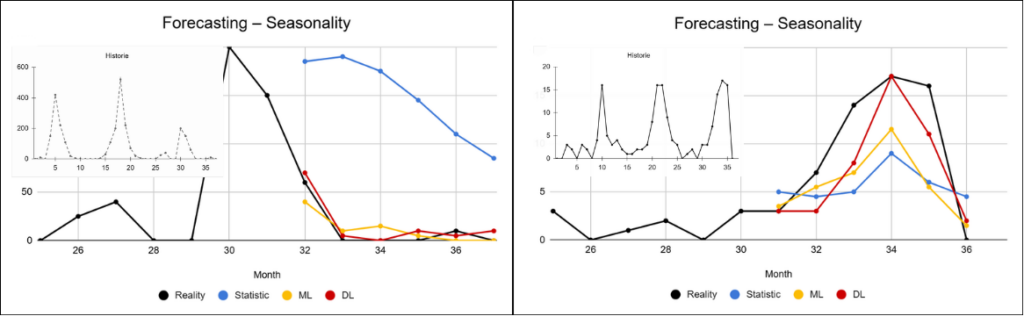
Some products exhibit strong seasonality, typically with recurring peaks during specific periods of the year, such as the Christmas season. In these cases, forecast accuracy depends heavily on the model’s ability to correctly capture repeating temporal patterns. With sufficiently long historical data, even simpler approaches can handle this problem reasonably well. However, once the available history becomes shorter or the seasonal behavior changes over time, these models begin to fail and the differences between approaches become much more significant.
For part of the product portfolio, sales occur irregularly without a clear pattern. Random fluctuations introduce noise into the data and make it difficult for models to distinguish between actual trends and random behavior. Simpler approaches tend to oversimplify such data and revert toward the mean. More advanced models, thanks to their larger number of parameters and ability to process additional information, have a better chance of capturing at least some of the hidden patterns, although even in these cases stable results cannot be expected.
Promotional events represent a specific challenge, as they create short-term but significant increases in sales volume. If the model has no information indicating that a promotion occurred, these spikes are interpreted as noise.
Simpler approaches are typically unable to interpret such changes correctly and often either ignore them or react with a delay. Even more advanced models face limitations when relevant input information is not available.
However, when this information is provided, more complex models can utilize it more effectively thanks to their ability to process a larger number of input variables and model the relationships between them.
In practice, these factors often occur simultaneously, significantly increasing the overall complexity of the problem. Their combination is one of the main reasons why simple models frequently fail in real-world scenarios and why the differences between approaches become much more pronounced.
This project demonstrates that forecast quality is determined not only by the choice of model, but primarily by the nature of the data itself. The length of available history has a major impact on how well a model can capture trends and seasonality. For products with sufficiently long historical data, the differences between approaches are relatively small, and simpler methods are often sufficient. However, as the available history becomes shorter, the models begin to diverge significantly — statistical approaches lose the ability to capture seasonality, while deep learning can partially compensate for the lack of data.
Other factors, such as seasonality and promotional events, also play a critical role. These increase data complexity and, without corresponding input information, represent a significant challenge for models regardless of their type.
The largest differences between approaches therefore do not appear under ideal conditions, but rather in the scenarios most common in practice — products with limited historical data combined with high variability caused by seasonality or promotions.
In the next article, we will examine a dataset where most observations consist of zero sales values — a scenario in which the differences between approaches become even more pronounced.
IČO: 172 28 018
DIČ: CZ 172 28 018
Data Box ID: ykwdnxf
sales@neebile.cz
Jičínská 226/17, Praha, Žižkov, PSČ 130 00 Česká republika
(910) 658-2992
© 2025 Vytvořeno DigitalWays